
Investigate DQ v6: Reporting For Duty

Investigate DQ version 6.0
Product enhancements include Intuitive dashboard and widgets, customisable reporting and the functionality to import data from multiple file formats.
Read more below.
Journal
Highly effective reporting and data quality management continues to be a hot topic in the industry. We believe that robust data quality management practices not only increase member engagement but also help solidify members’ trust in the company.
Recognising a growing demand for more control and customisation around reporting, we are pleased to present the latest version of Investigate DQ featuring some significant enhancements that reaffirm our commitment to meeting our customer’s needs for superior data quality management.
This version of Investigate DQ is available to all our existing and future customers, and includes:
Customisable Dashboards and Widgets
Users will now be able to create their own custom dashboards and reporting widgets. It’s a new framework for how the product reports data quality and will continue to do so with more features coming in future versions.
This functionality has been designed to be intuitive and easy to use. A dashboard can be set up in a matter of minutes, allowing users to see a quick and organised overview of all their data in one spot. This is available in Clarify, our reporting module, or throughout Investigate DQ.
Customisable dashboards allow our clients to have different views on their data quality catered to different audiences - from the operational level to the executive level. They help with understanding the current state and trends in their data and identifying critical issues that require immediate action.

Customisable dashboard and widgets
Customisable Reporting
Dashboard visualisations can be customised to get a high level or a granular view on data quality. We’ve included filters that can easily be applied to change the view and selection that users will see by default while also retaining the ability to interact with the widgets and drill-in to sections of graphs for an in-depth view when required.
The customisable view on reporting will provide more effective and meaningful reporting to clients while also empowering users to redesign and refine their reporting to better understand the specifics of their data quality and trends in their data eco-system.

Customisable reporting
Structured File Import
Another significant feature is the introduction of the Structure File Import which allows data from multiple sources to easily be imported by users from any number of flat files, delimited files or even Excel spreadsheets, all into one system.
The ability to bring in multiple non-live data sources helps broaden the scope of data quality checks that can and should be performed in a systematic and flexible manner. This ensures our clients are getting the most out of the product and can validate all data outputs that flow through their organisation.
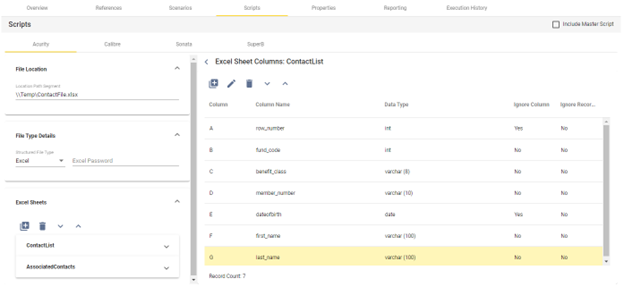
Structured file import
As always, we strive to improve Investigate DQ for all our customers so we can play our part in improving data quality across industries. We believe in better outcomes for our customers and in turn, their customers.
We are always thrilled to hear about your data quality challenges and see what Investigate DQ can do to help.
Regards,
Tom
Tom Seel – Product Manager, Investigate DQ
